via ayjay
More in #MindMaps:
“The network graph shows how different options are related to each other: they are closer if a greater number of MPs have voted for them. Their size shows the number of favourable votes for each option (none of them obtained a majority.”

In the graph above (zoomable version here), I have mapped the votes of British MPs in the 8 options given to them on March 27 (a couple of hours ago) in indicative votes. This is a 2-mode network linking MPs and options for Brexit. The network graph shows how different options are related to each other: they are closer if a greater number of MPs have voted for them. Their size shows the number of favourable votes for each option (none of them obtained a majority. The graph show the high level of polarisation over these different options, with two clear poles: the “Hard Brexit” pole with a number of MPs for whom the only option is No Deal, or a preferential trade arrangement, and the Soft Brexit-No Brexit pole, linking the Customs Union, Labour’s Plan and a Second Referendum/Revocation of article 50. The EFTA/EEA and Common Market 2.0…
View original post 20 more words
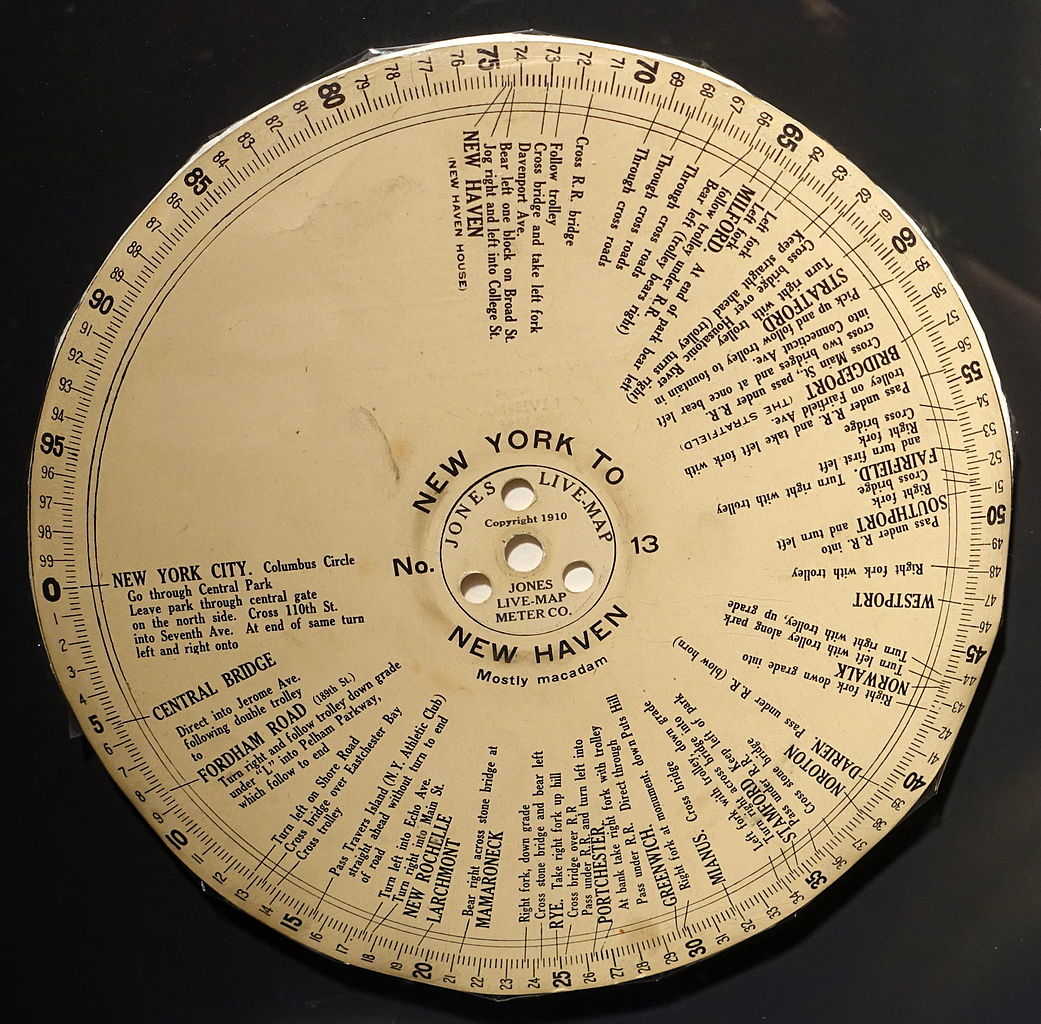
“Under its guidance the most muddling twists, turns and corners melt away behind you,” read the advertisement. “It is better than a Human Guide because it is always doing its work to the exclusion of everything else. … The Jones Live-Map emancipates you from slavery to great, flopping maps and profound route-books that you can’t make head or tail of without stopping.”
more at Futility Closet

Wow, people really liking the notebook pages and the mind maps. Thanks all it’s been a great year, so far.
I’m really going to work hard on making more posts in 2019, so let’s see how that goes.
Thanks all!
🙏❤️ 🕸

It’s been really interesting going through an old book like this and systematically posting everything I can. I have more, so after a short break I’ll begin again on Myrtle.
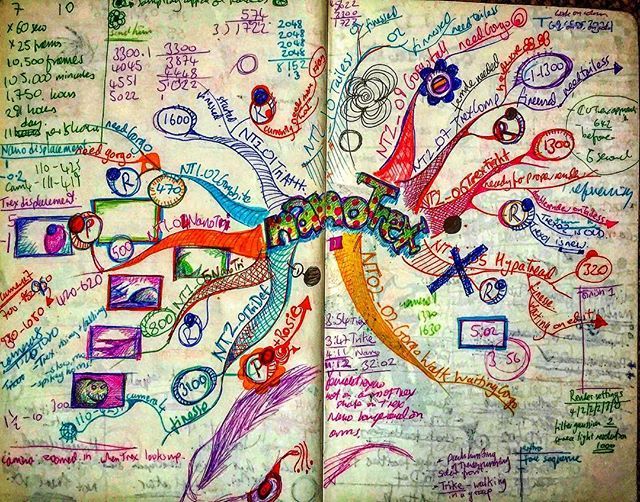
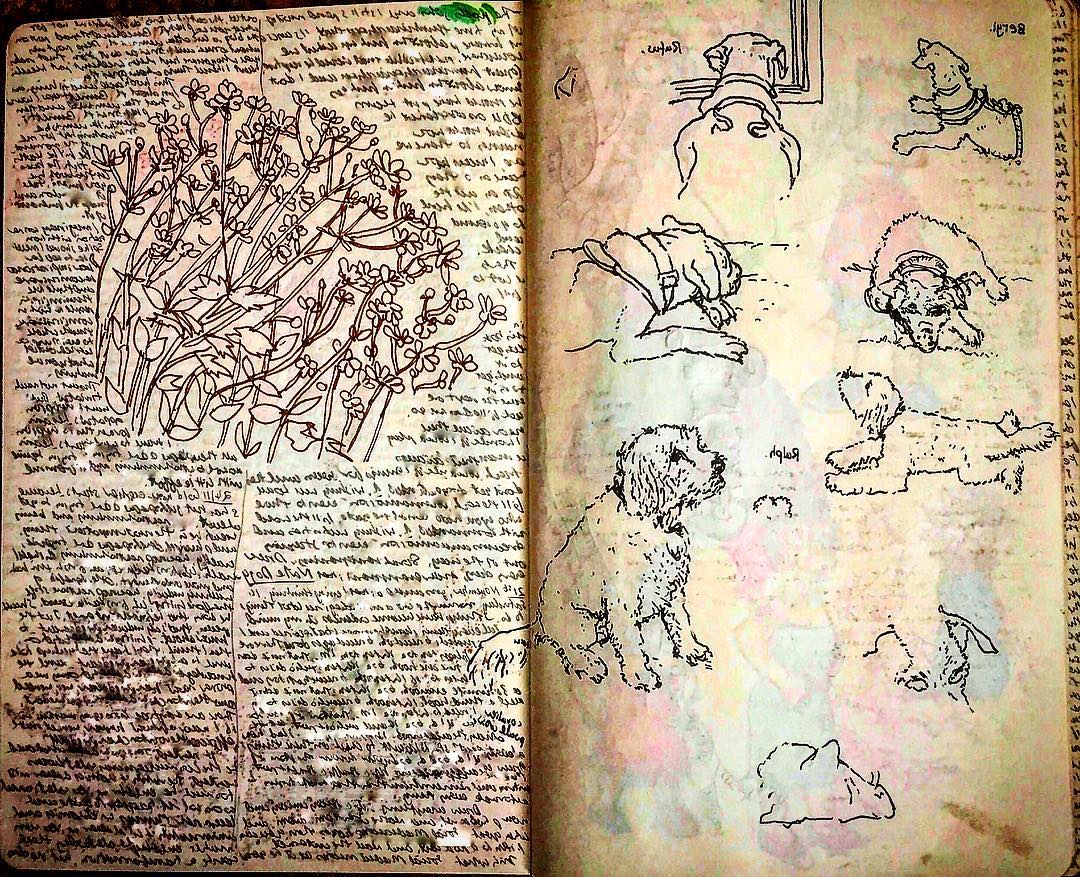 Notebook Ethel, spread forty. Garbage writing, Cornish undergrowth, and office dog drawings (three varieties). 🌿🐕✍️
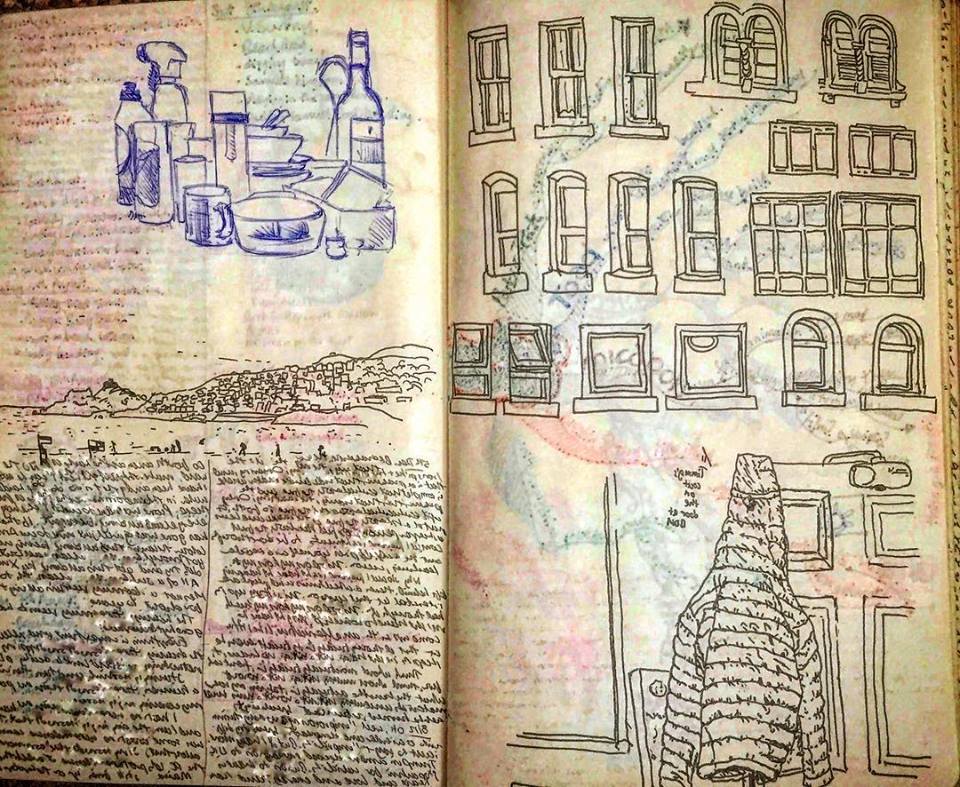
 Notebook Ethel, Spread forty-two. Kitchen still life in biro, Clifton windows, garbage writing (obscured) and @3dtimmy’s coat. 🥛 🏠 🧥
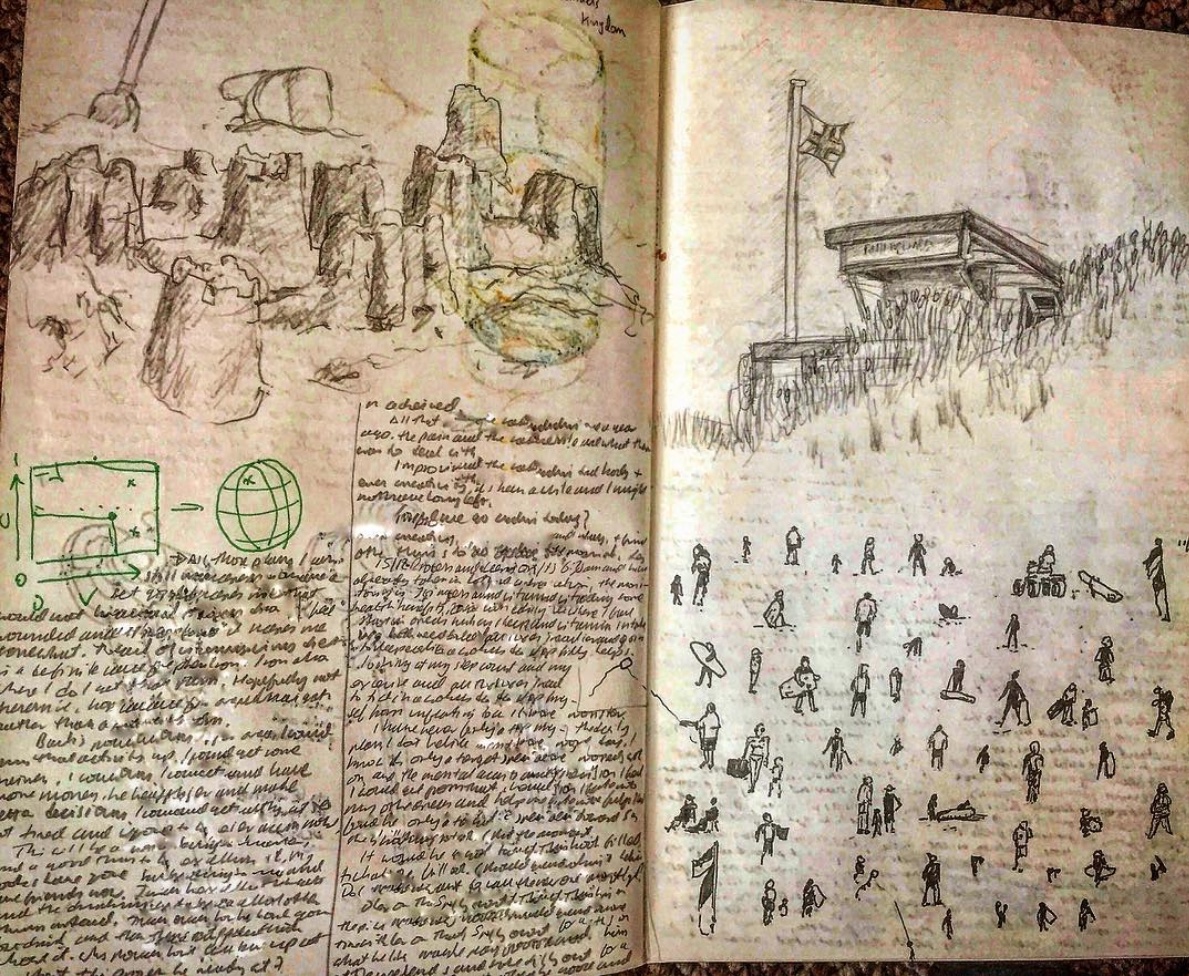
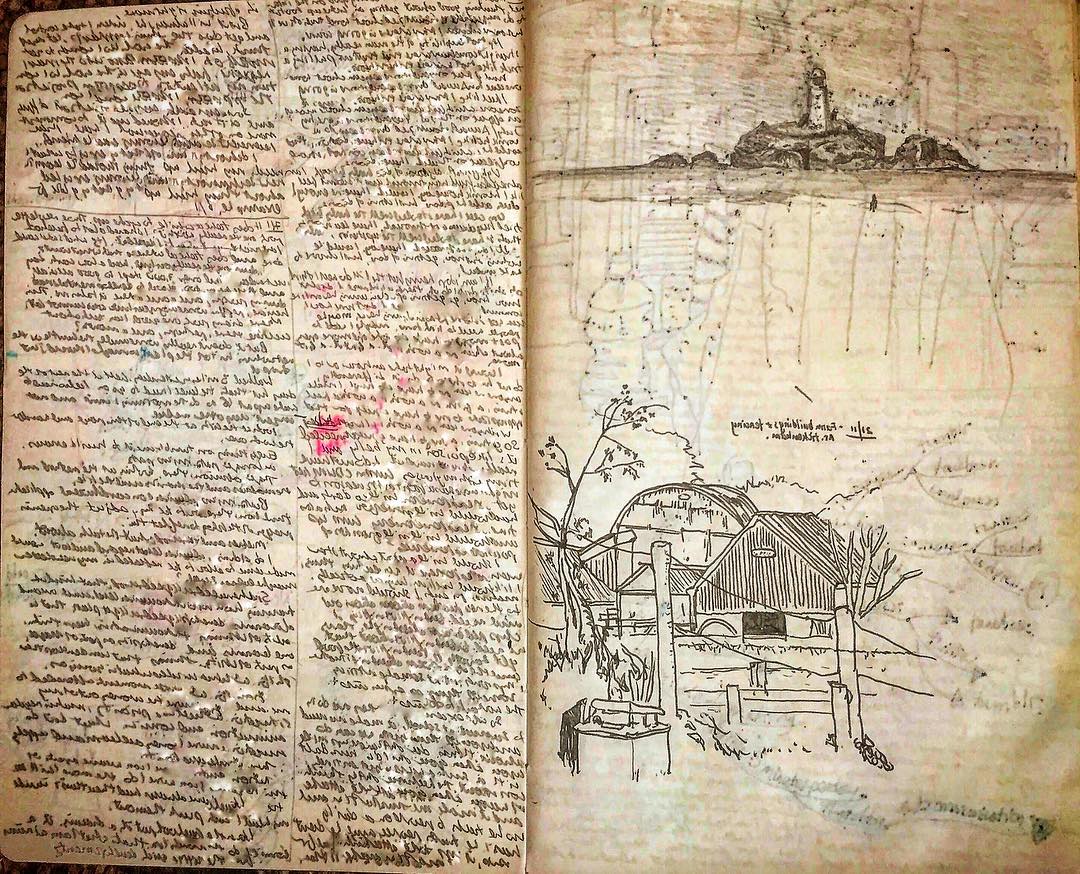 Notebook Ethel, spread Forty-Four. More Cornish drawings, Godrevy Ligjthouse, garbage writing and stables. ✍️ 💡 🐴
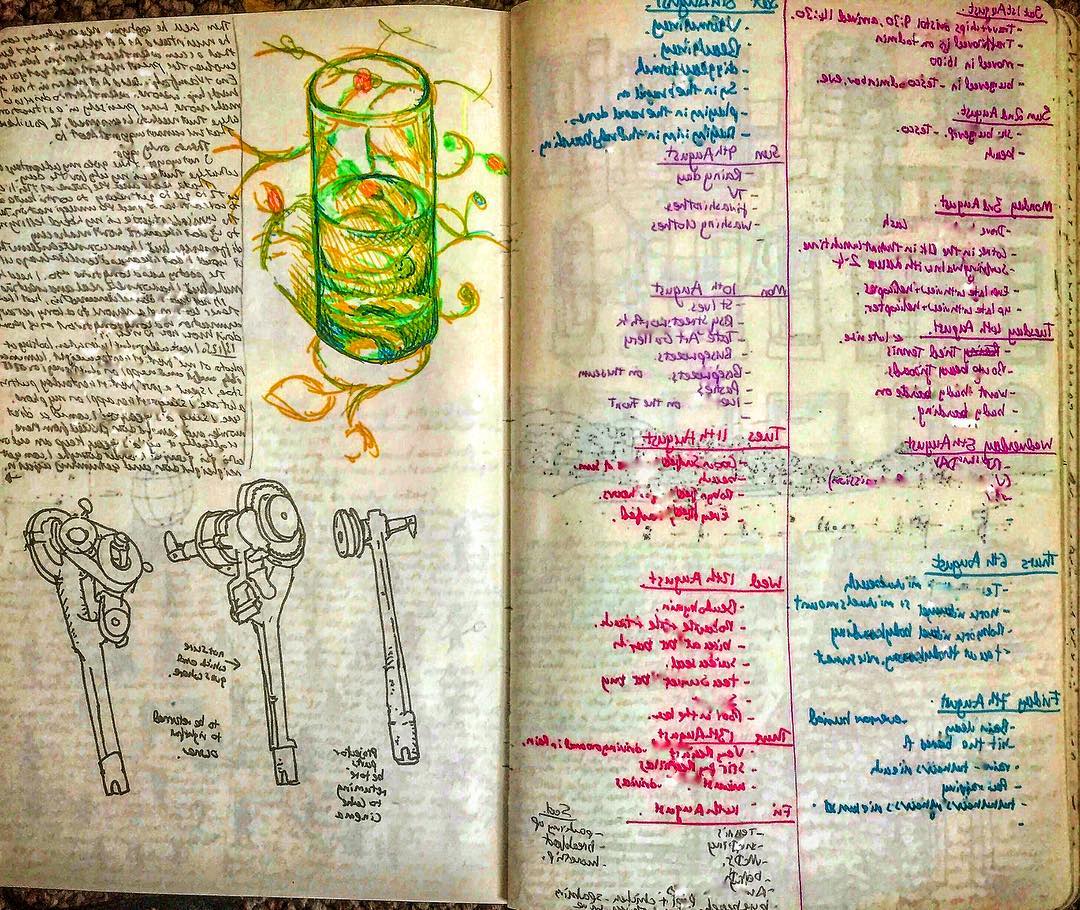
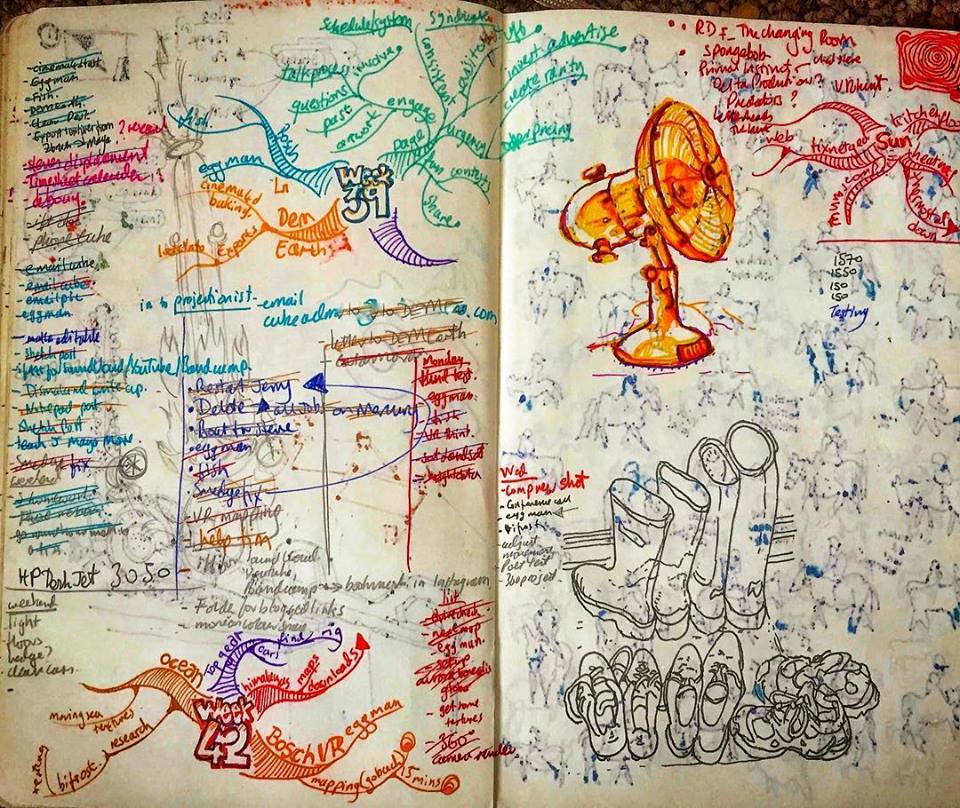 Notebook Ethel, spread forty- five. To do lists, mini mind maps, drawings of family shoes and desk fan. 👞 🕷 🗺
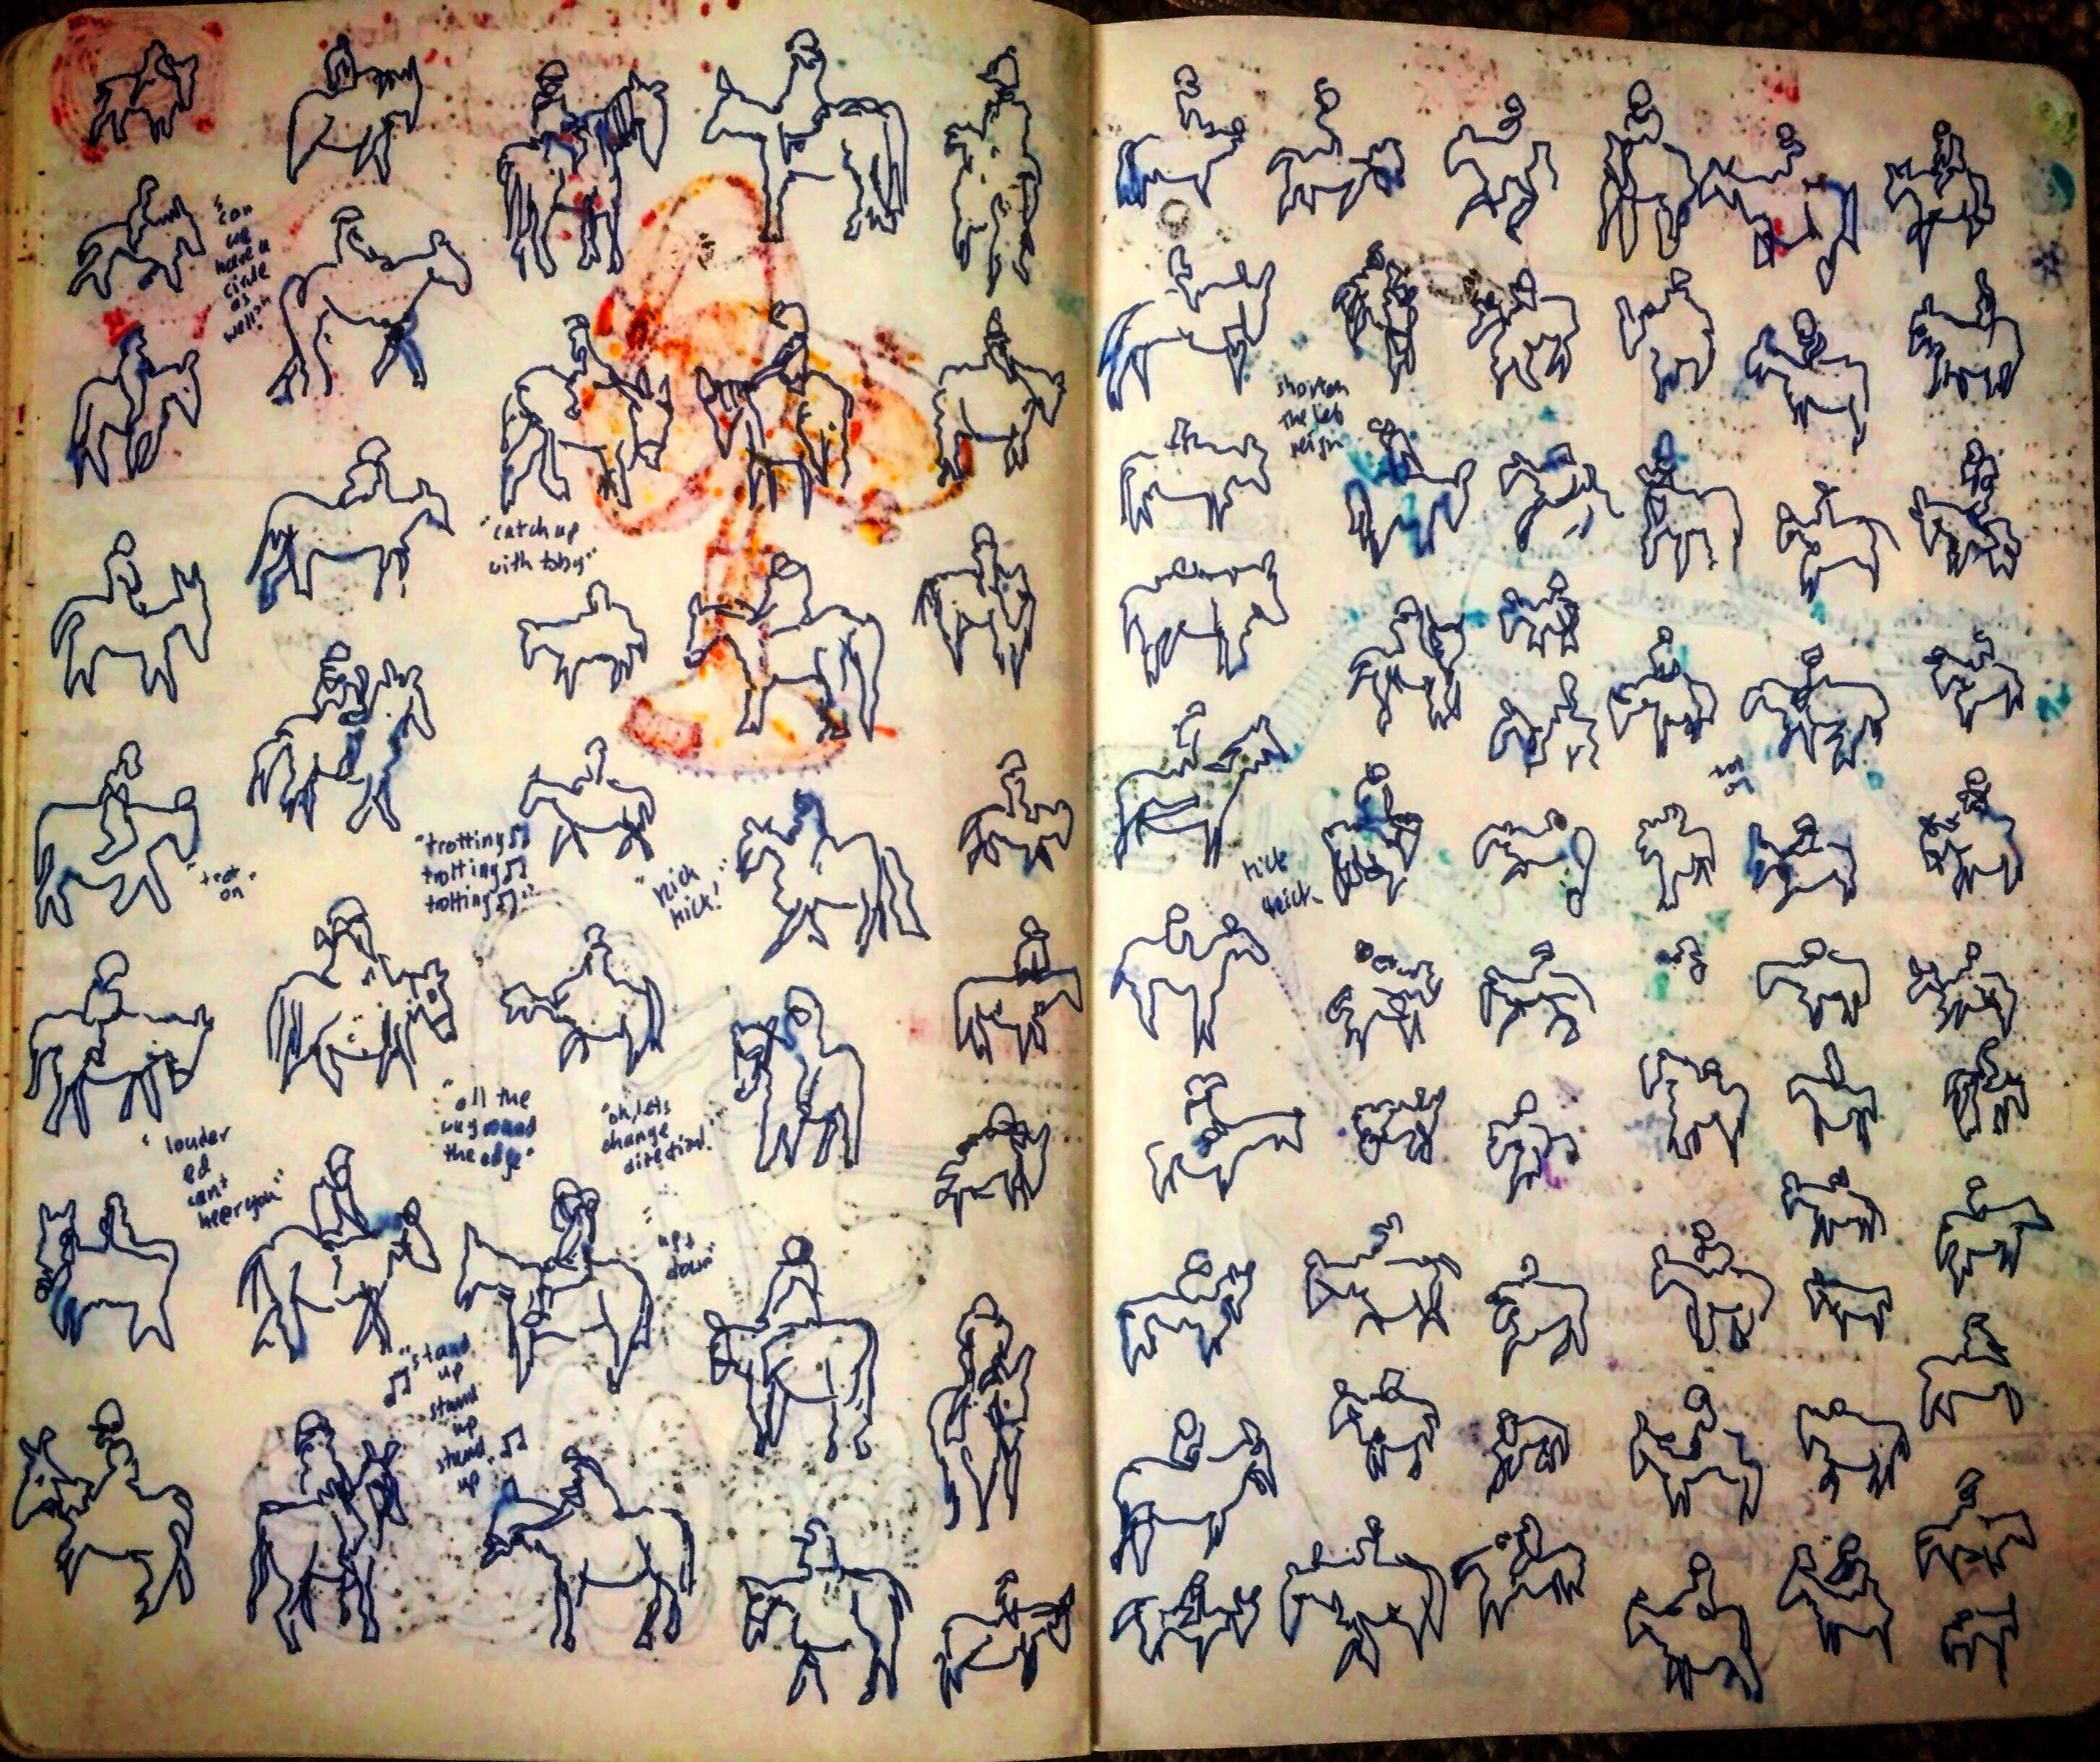 Notebook: Ethel, spread forty-six. Horse and rider drawings from life, went on to become the animation I have in my current pinned tweet. About 40 mins. Pencil and fountain pen. 🐎 🖊 🎞
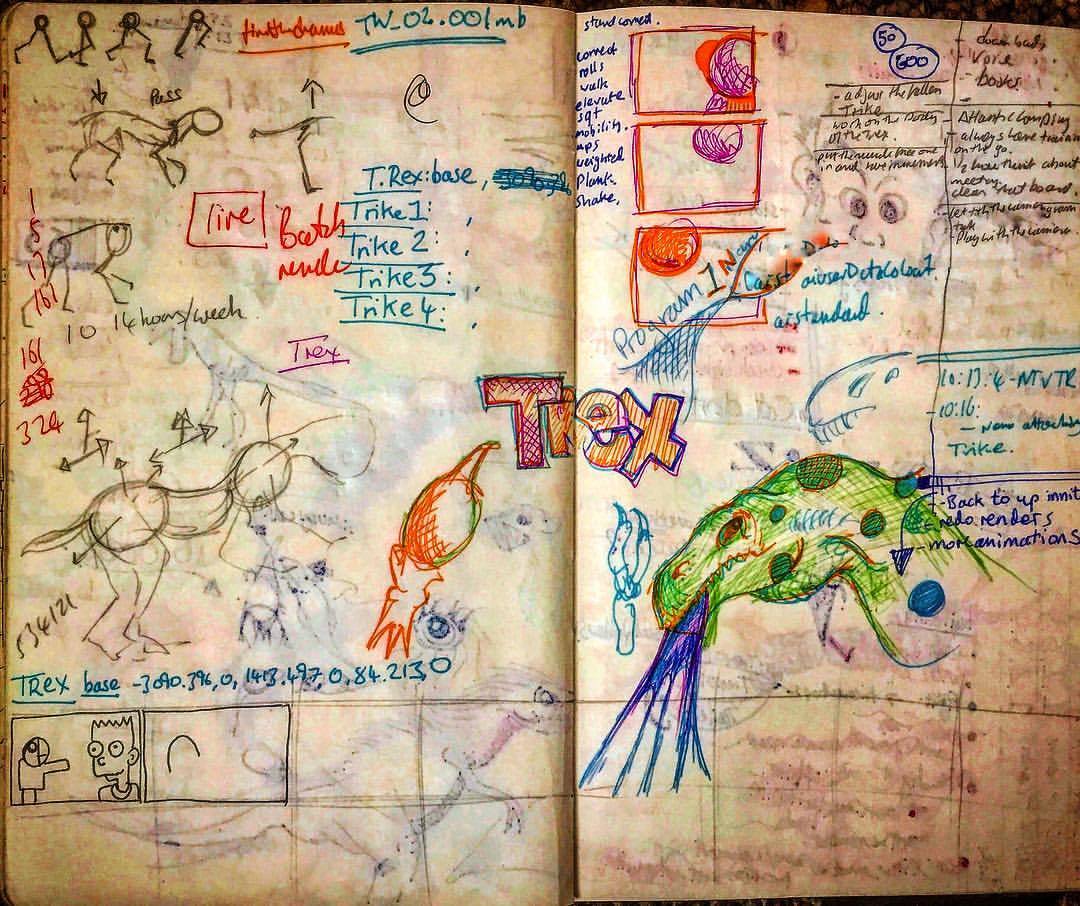
 Notebook Ethel: Spread Forty-Seven. It’s the last page from Ethel!! Classic work page. I do not usually share work stuff but this is all non-descript information on creating landscapes from DEM data. 🕸 🏔 ✏️

“For over 150 years scientists have tried to solve the mystery of a controversial cuneiform clay tablet that indicates the so-called Köfel’s impact event was observed in ancient times. The circular stone-cast tablet was recovered from the 650 BC underground library of King Ashurbanipal in Nineveh, Iraq in the late 19th century. Long thought to be an Assyrian tablet, computer analysis has matched it with the sky above Mesopotamia in 3300 BC and proves it to be of much more ancient Sumerian origin. The tablet is an “Astrolabe,” the earliest known astronomical instrument. It consists of a segmented, disk-shaped star chart with marked units of angle measure inscribed upon the rim.”
UPDATE:
Upon posting this item I got some feedback from internet friend and self-proclaimed Noticer Of Things, Chris Harris. Please find his updates below:

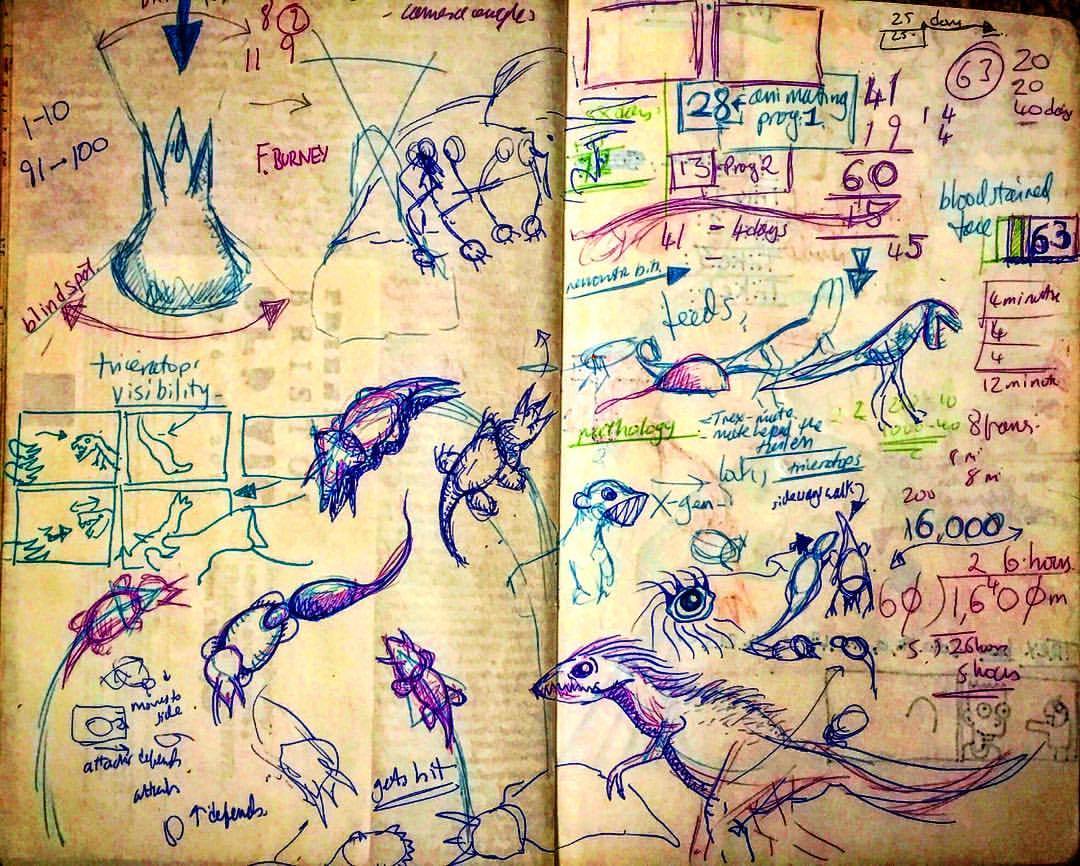
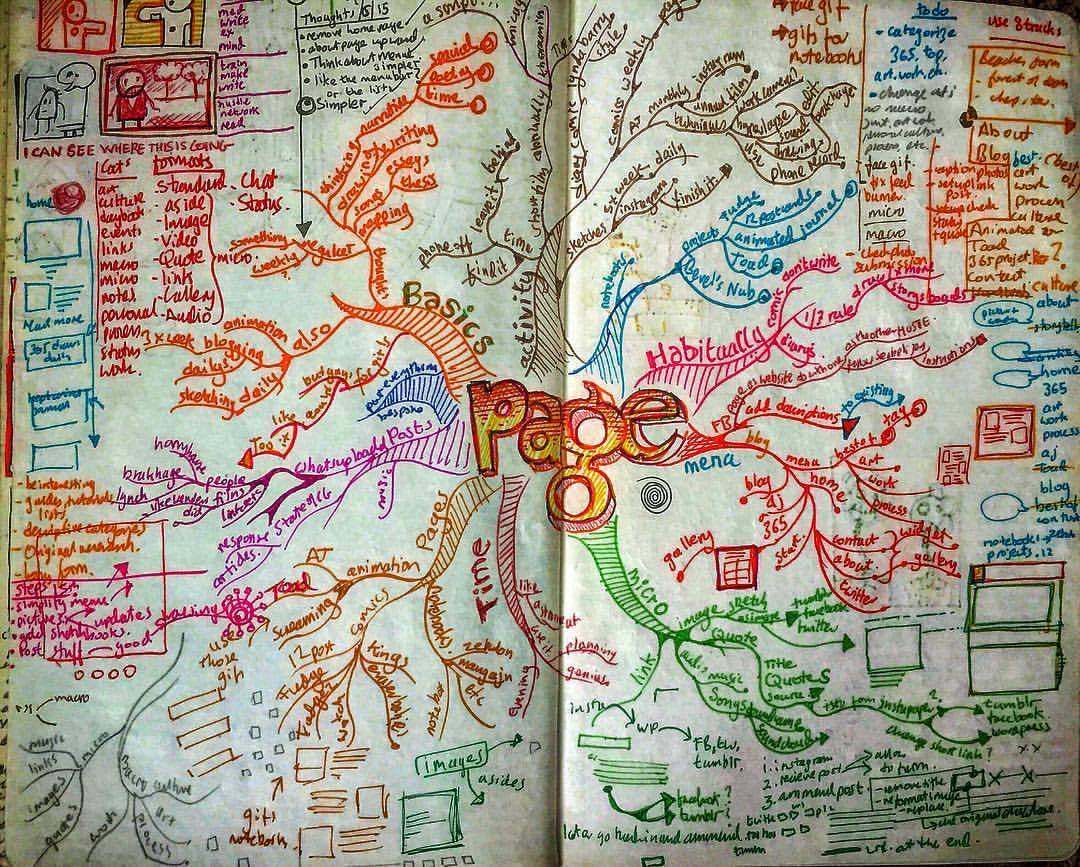


Mind map, notes, doodles and lists for the graphics and CGI in what was to become “Countdown to Life”, then called 9 Months., which followed the development of the human foetus through the 9 months of gestation.
🗺 👶 📓
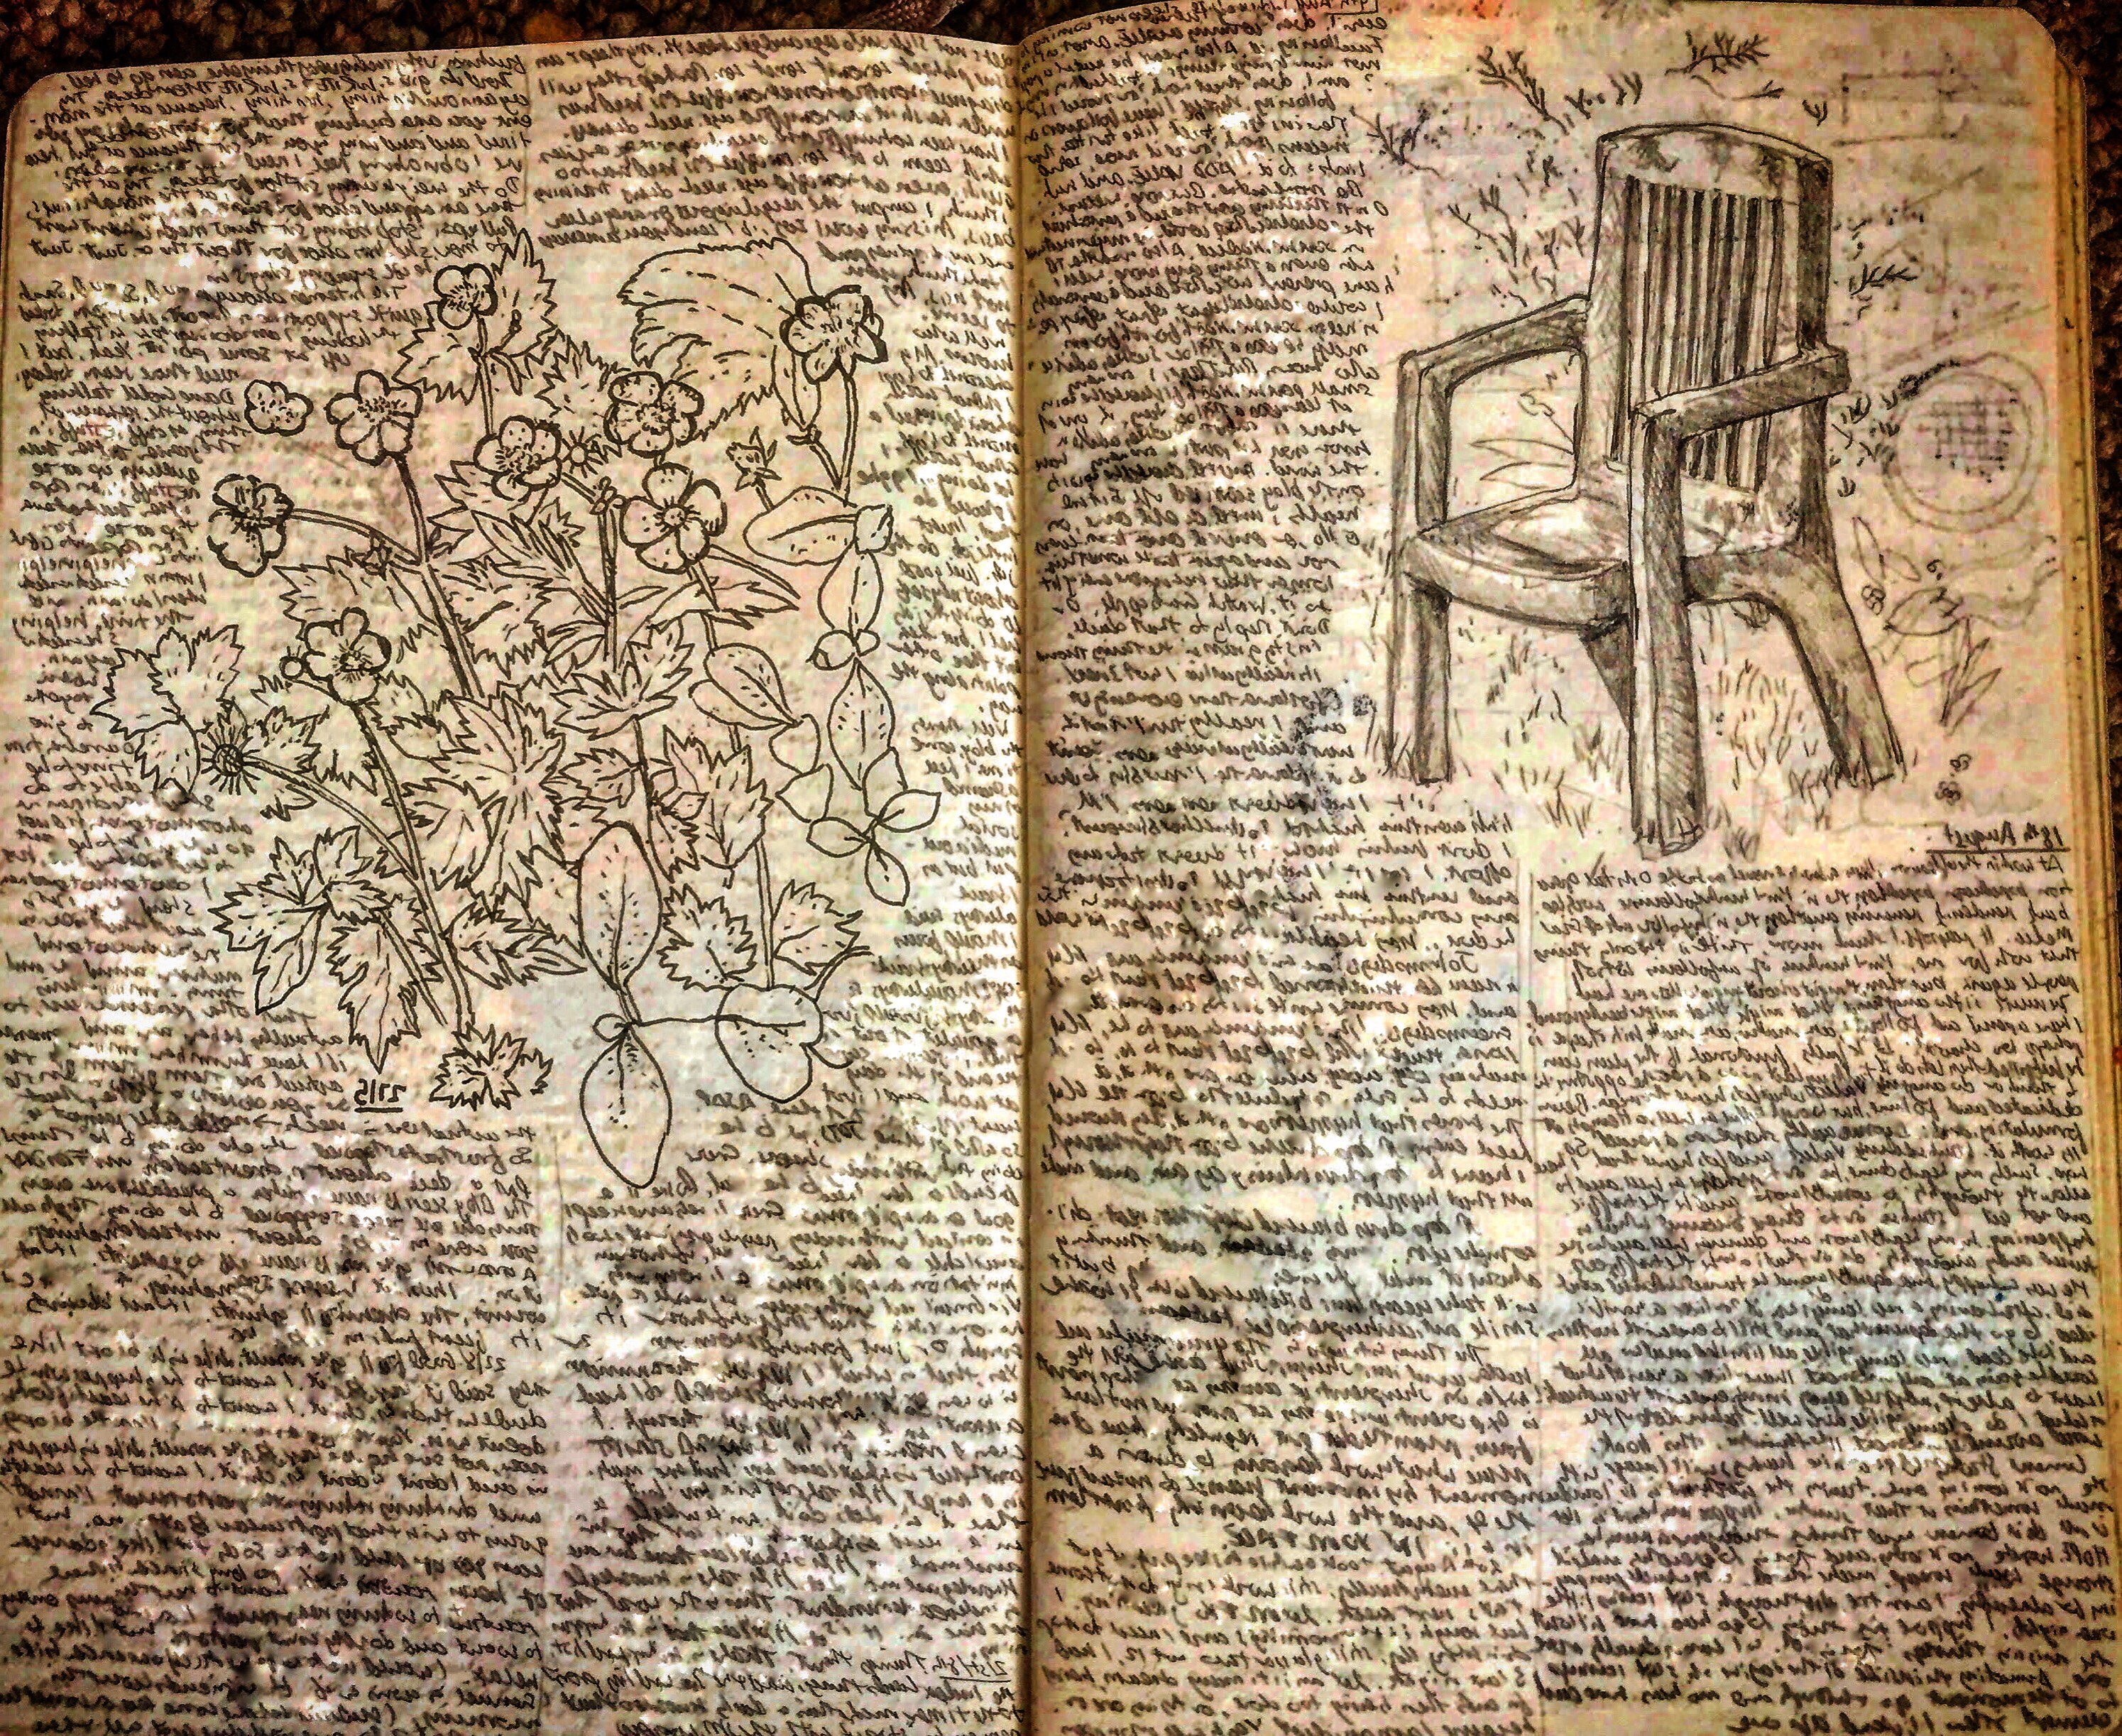
Garden chair, ornamental bush and garbage writing. Ornamental bush is a bit hidden in the mess, but it is there.
🌳✍️🛋
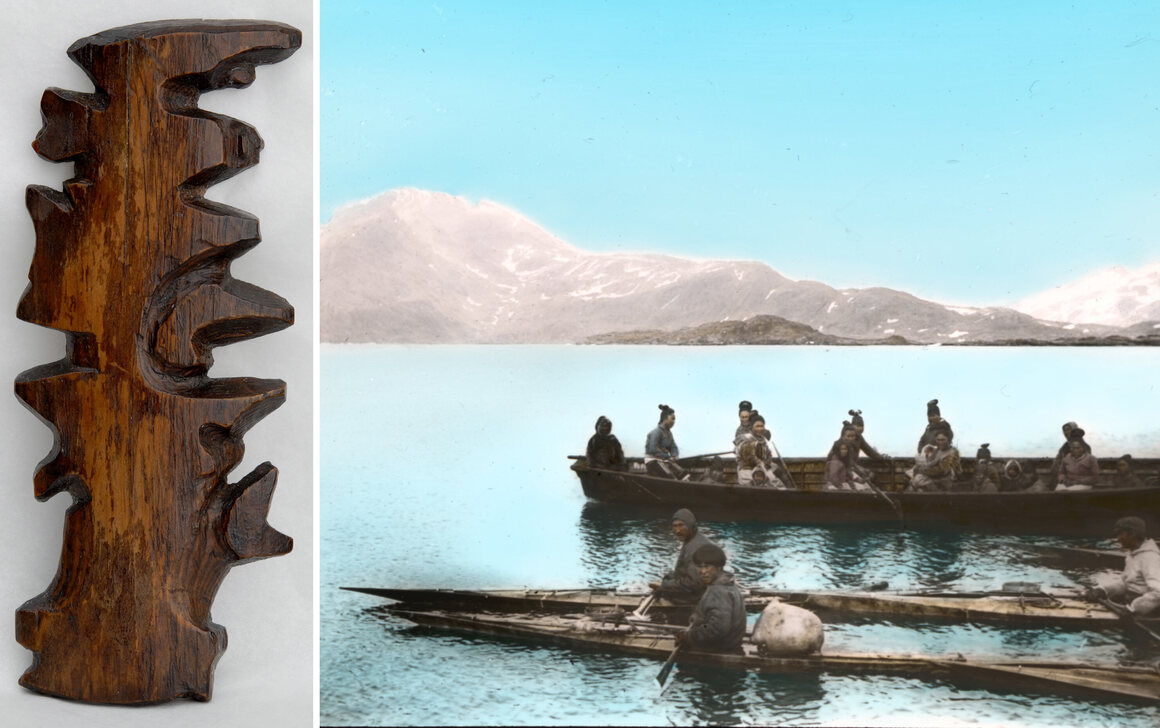
“For these seafaring people, geographic knowledge was something remembered and shared through stories and conversations of travels and hunting. “The drawing of charts and maps,” Holm wrote, “was of course quite unknown to the people of [Ammassalik], but I have often seen how clever they were as soon as they grasped the idea of our charts. A native from Sermelik, called Angmagainak, who had never had a pencil in his hand and had only once visited the East coast, drew a fine chart for me covering the whole distance from Tingmiarniut to Sermiligak, about 280 miles.” They also provided him with incredibly detailed descriptions of terrain, flora and fauna, and, in some cases, local weather patterns and lunar and solar cycles. To pass some of this knowledge on to the curious, acquisitive Holm, one hunter presented him with a set of unusual maps that have been, by turns, overlooked, discounted, misunderstood, and, eventually, admired.”
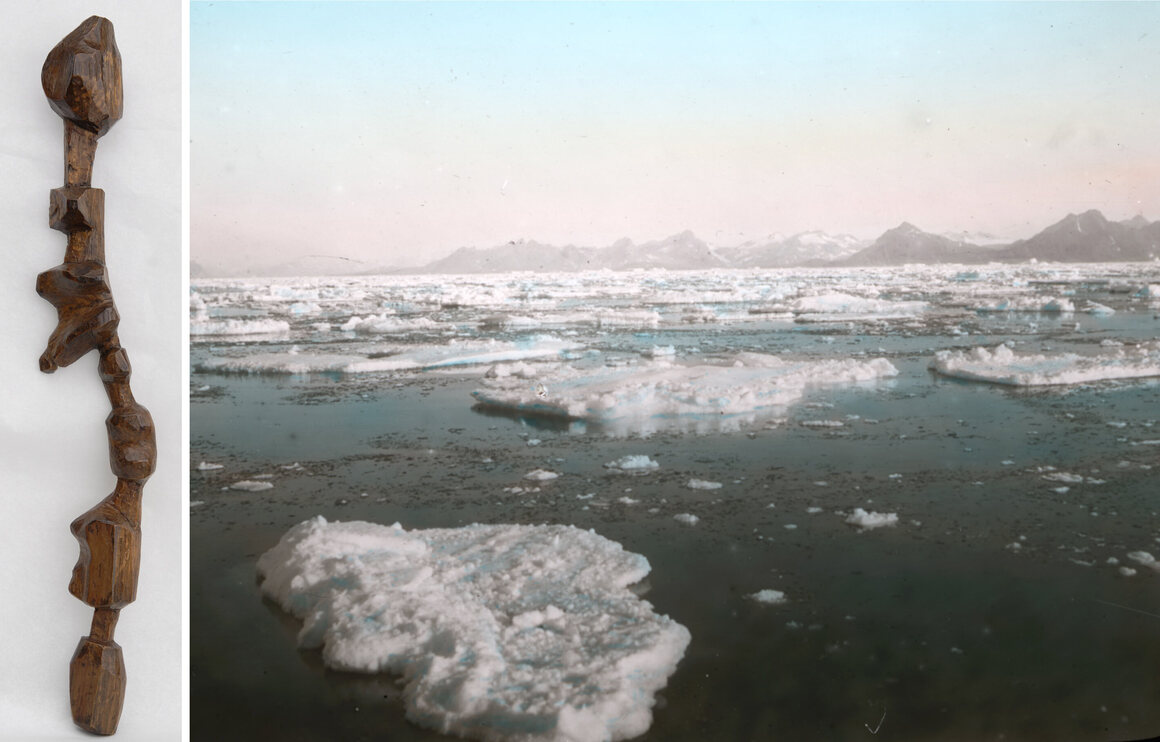
“But woodcarving was a common activity among the Tunumiit and Holm mentions that carving maps was not out of the ordinary. The Inuit people have used carvings in a certain way—to accompany stories and illustrate important information about people, places, and things. A wooden relief map, would have functioned as a storytelling device, like a drawing in the sand or snow, that could be discarded after the story was told. As geographer Robert Rundstum has noted, in Inuit tradition, the act of making a map was frequently much more important than the finished map itself. The real map always exists in one’s head. Though the maps themselves are unique, the sentiments and view of the world they represent were universal to the culture that made them.”
…Much more including annotated manipulatable 3-d models on this great post from Atlas Obscura.
reblogging Ben Katchor:
from A. F. Ward’s Universal System of Semaphoric Color Signals, 1862
“A Novel and Original Invention, by which 46,656 words or sentences can be represented with six colors, intended as A Medium of Communication between all Nations, and Applicable to any Language; also adapted to sound and night signals, by which communications may be made at all-seasons, without regard to weather.”

via benkatchor