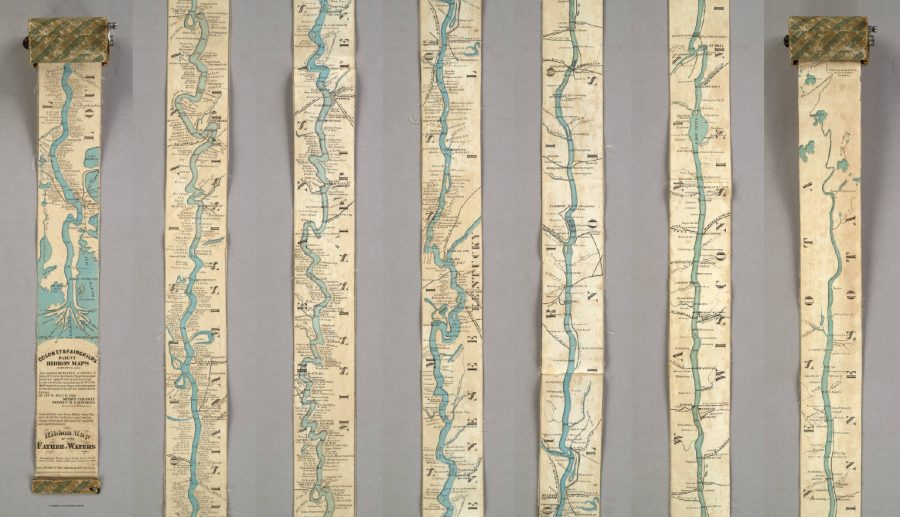
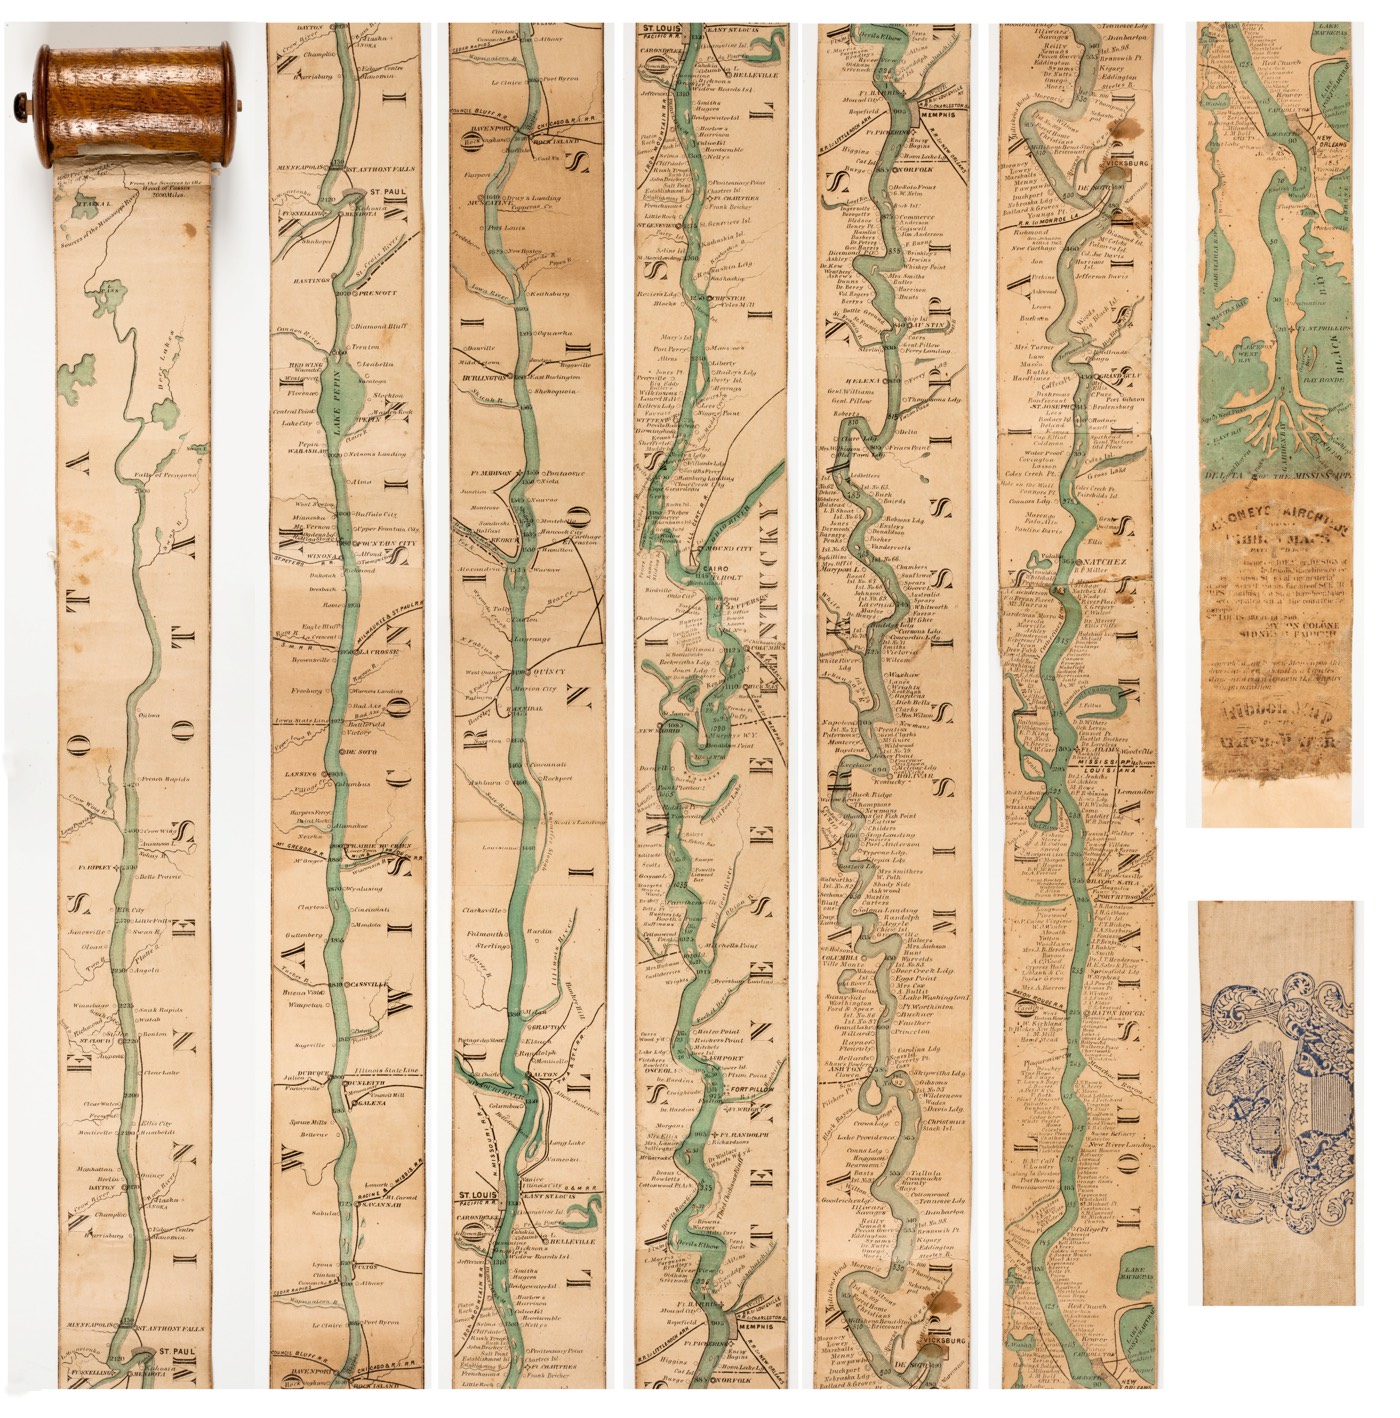
“Coloney and Fairchild’s patented apparatus required that the single sheet be cut into strips, attached end-to-end, mounted on linen, and then rolled inside a wooden, metal, or paper spool (fig. 4). The resulting portability of the map was crucial because, as advertisements indicated, it was intended for business travelers, steamboat navigators, and tourists. Of this form, the Newberry Library and the Minnesota Historical Society Library hold what seems to be a first edition, while nearly a dozen archives around the U.S. hold an updated second version. With the addition of hundreds of towns, mile markers, islands, landings, landowner and plantation names, and significant Civil War locations, the Lower Mississippi appears to be a settled and thriving commercial space.”
“For these seafaring people, geographic knowledge was something remembered and shared through stories and conversations of travels and hunting. “The drawing of charts and maps,” Holm wrote, “was of course quite unknown to the people of [Ammassalik], but I have often seen how clever they were as soon as they grasped the idea of our charts. A native from Sermelik, called Angmagainak, who had never had a pencil in his hand and had only once visited the East coast, drew a fine chart for me covering the whole distance from Tingmiarniut to Sermiligak, about 280 miles.” They also provided him with incredibly detailed descriptions of terrain, flora and fauna, and, in some cases, local weather patterns and lunar and solar cycles. To pass some of this knowledge on to the curious, acquisitive Holm, one hunter presented him with a set of unusual maps that have been, by turns, overlooked, discounted, misunderstood, and, eventually, admired.”
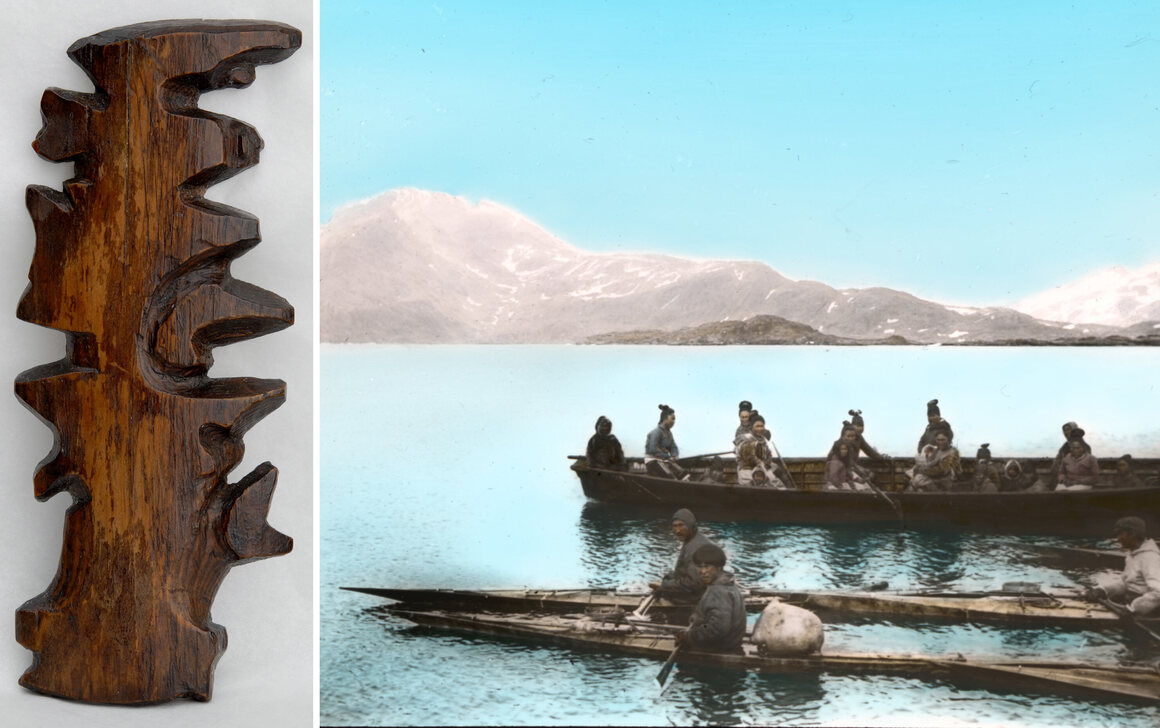
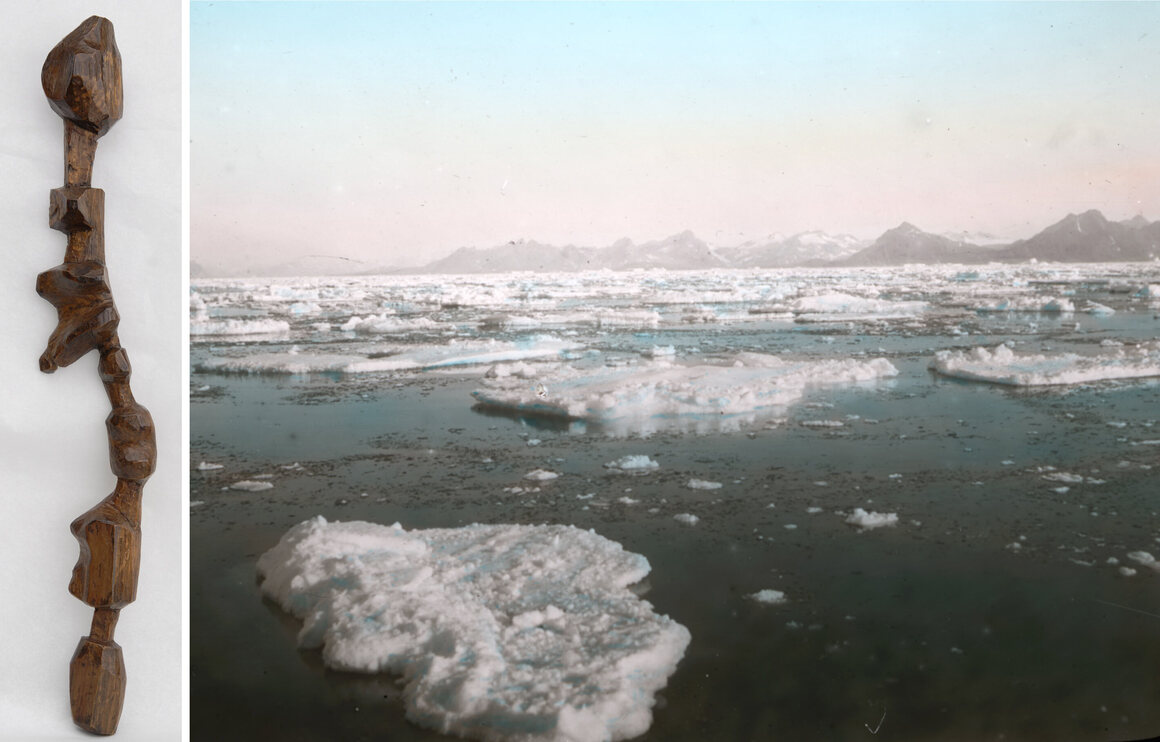
Left: a wooden map of islands off the East Greenland coast, c. 1885; Right: ice field, Ammassalik, East Greenland, 1908, by Th. N. Krabbe.
“But woodcarving was a common activity among the Tunumiit and Holm mentions that carving maps was not out of the ordinary. The Inuit people have used carvings in a certain way—to accompany stories and illustrate important information about people, places, and things. A wooden relief map, would have functioned as a storytelling device, like a drawing in the sand or snow, that could be discarded after the story was told. As geographer Robert Rundstum has noted, in Inuit tradition, the act of making a map was frequently much more important than the finished map itself. The real map always exists in one’s head. Though the maps themselves are unique, the sentiments and view of the world they represent were universal to the culture that made them.”
…Much more including annotated manipulatable 3-d models on this great post from Atlas Obscura.
“The first rule of geography is that everything is related to everything else. Today’s cartography reflects exactly that: It combines design, geography, anthropology, human impressions and ideas within spatial contexts. It’s a connector, an aggregator. And, increasingly, it’s a way of telling stories.”
First, I am lucky enough to have a number of positive impacts of dyslexia. One of those is that once I have acquired new information I can process it very rapidly and often have multiple thoughts at once. That often means that I can solve the most complex problems faster than others.
Second, I have a problem writing and thinking at the same time. I believe it is to do with short-term memory. However, the bottom line is that I keep forgetting where I am in the overall flow of the thing that I am writing. As a result, my writing meanders and needs to be edited (by me) again and again until it finally expresses what I mean.
Thirdly, I see patterns in things – often before others. I use that to form and then set out compelling arguments and explanations that become very clear to readers.
Finally, I have a fairly precise use of language and so – whilst not finding it easy to write – am a fierce critic of my own work. So that means the editing can take a very long time.”
“Kowloon Walled City was a largely ungoverned, densely populated settlement in Kowloon City in Hong Kong. Originally a Chinese military fort, the Walled City became an enclave after the New Territories were leased to Britain by China in 1898. Its population increased dramatically following the Japanese occupation of Hong Kong during World War II. By 1990, the Walled City contained 50,000 residents[1][2] within its 2.6-hectare (6.4-acre) borders. From the 1950s to the 1970s, it was controlled by local triads and had high rates of prostitution, gambling and drug abuse.”
detailed view of the cross-section illustrates a mahjong parlor, a strip club and a plastics factory
“The Kowloon Walled City in Hong Kong was once the most densely populated place on earth. And without a single architect or any oversight whatsoever, the ungoverned hive of interlinking buildings became a haven for drugs, crime and prostitution. This is perhaps why the surreal, M.C. Escher-like structure, where one couldn’t even begin to imagine what life was like, captured the interest of the Japanese.”
detailed view of the cross-section illustrates a cafeteria and a tunneled passageway that’s always leaking rain water
“It was (anonymously) produced by the Dieppe school (France) in 1547 and was either copied from Portuguese maps or was completed with the input of (a) Portuguese cartographer(s)
The maps are known as portolan (navigational) charts [previously]
Unusually, north is shown at the bottom of the maps in the style of Muslim cartographers (very rare in European Christian mapping)
Allegedly, this atlas shows the first ever European record of Australian coastline — some 250 years ahead of Capt. Cook and 60-odd years before the earliest official European discovery/sighting/mapping of any Australian coastline by William Janszoon in 1606 [see: Landing List].<
The miniatures and marginalia depict 16th century native and colonisation scenes
“In the south of Brazil, in the centre of the picture, two opponent Tupi-tribes are fighting against each other. Further southward a Native American lumberjack is felling a tree for a European merchant. In the north tree-trunks are transported and a second group of natives is moving westward, accompanied by two Europeans. The Europeans are probably Frenchmen, although Brazil had been held by the Portuguese since 1500. As neither gold nor silver was found, Portuguese interest rapidly decreased, and for many years only French privateers came there after Brazilian wood.”
“This chart, displaying part of the Atlantic coast of South America, with Uruguay and the mouth of the Rio de la Plata at the top as the most southern point, and the area around Pernambuco as the most northern region, is one of the charts in an atlas that was made in Dieppe about 1538. The Dieppe cartographers were known for their reliable cartographic material, which they also presented in a very artistic way. They had excellent contacts with Portuguese cartographers, the experts *par excellence *of maritime cartography at the time. No wonder that the basic material for this atlas also came from the Portuguese: the geographical representation, the windroses indicating the points of the compass, and the spelling of the plotted place-names, all point to this origin.”
 found via Kottke